


Explore the 85 cities with the cleanest air, ranked by the fine particles (PM2.5) measured near each one, with their haze seasons.
The places with the cleanest air, ranked by the fine particles (PM2.5) near each one; pick your month and every place re-sorts by that month's air.
 Spain
SpainThe places
 Argentina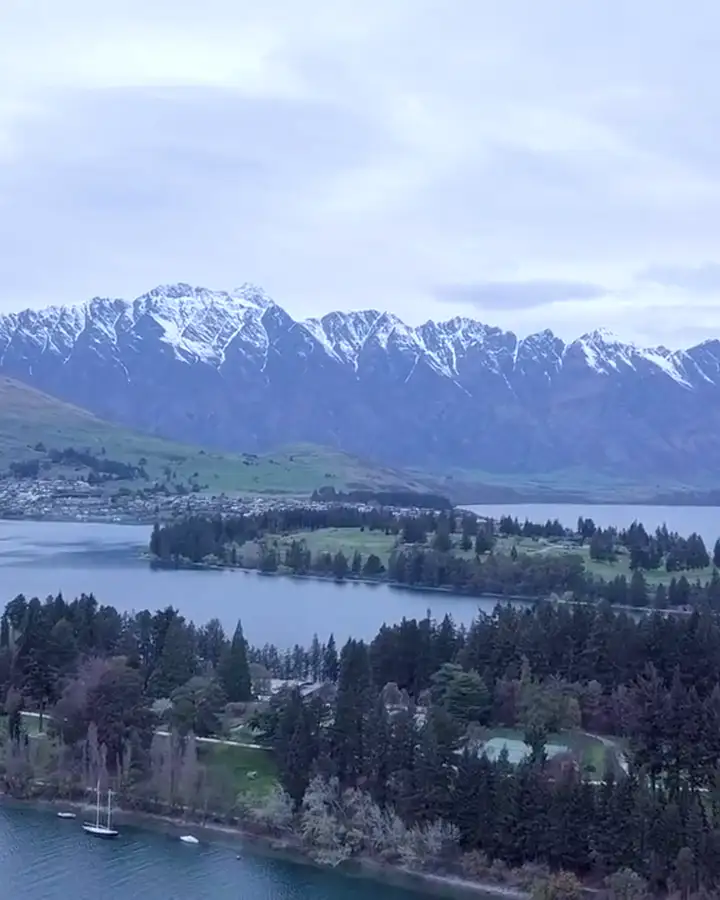
 New Zealand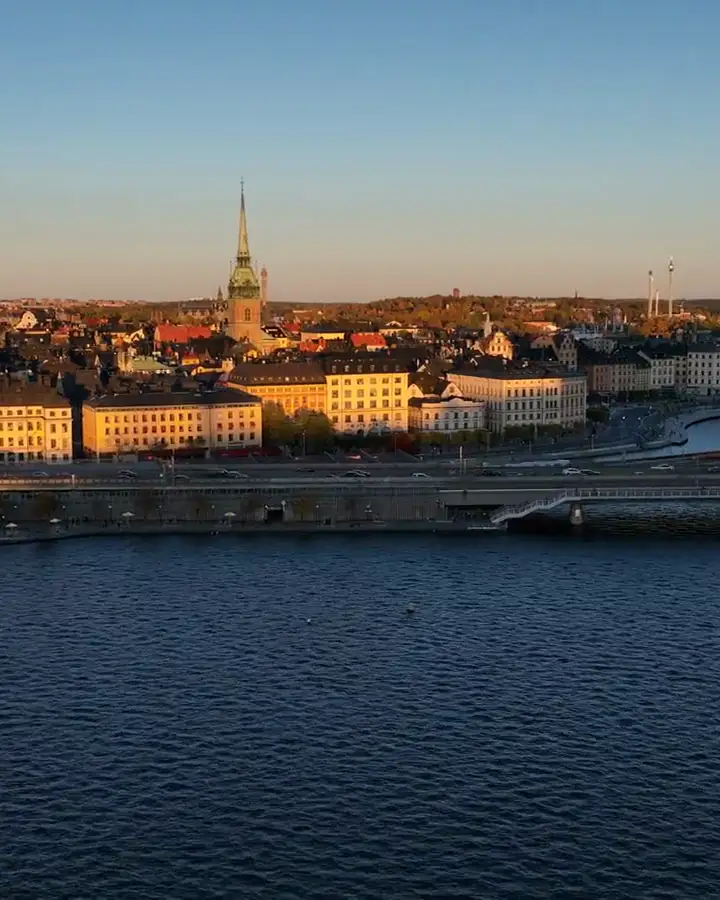
 Sweden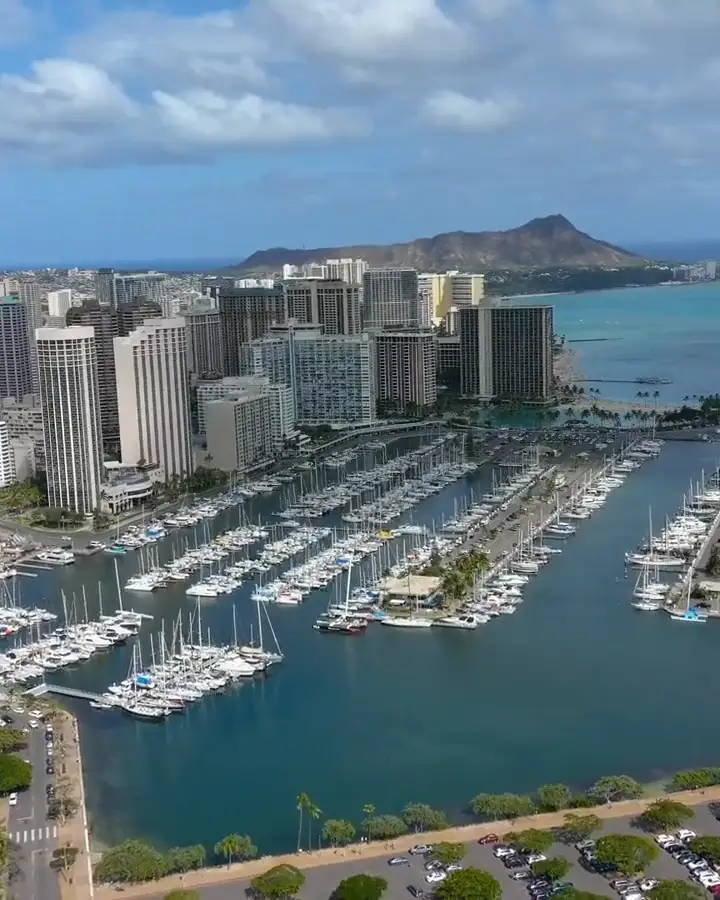
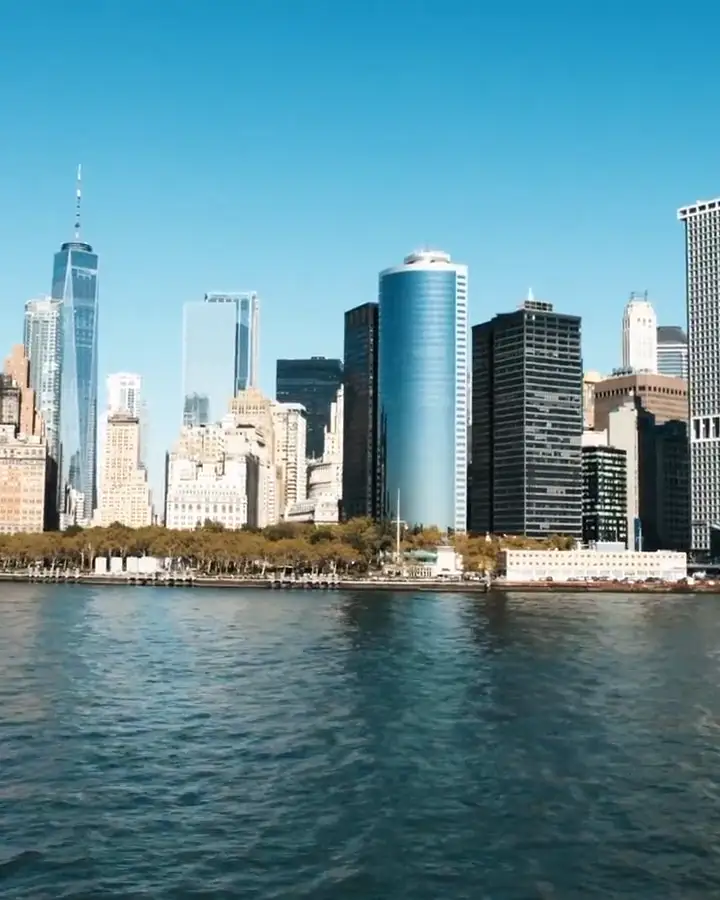
 United States
 Estonia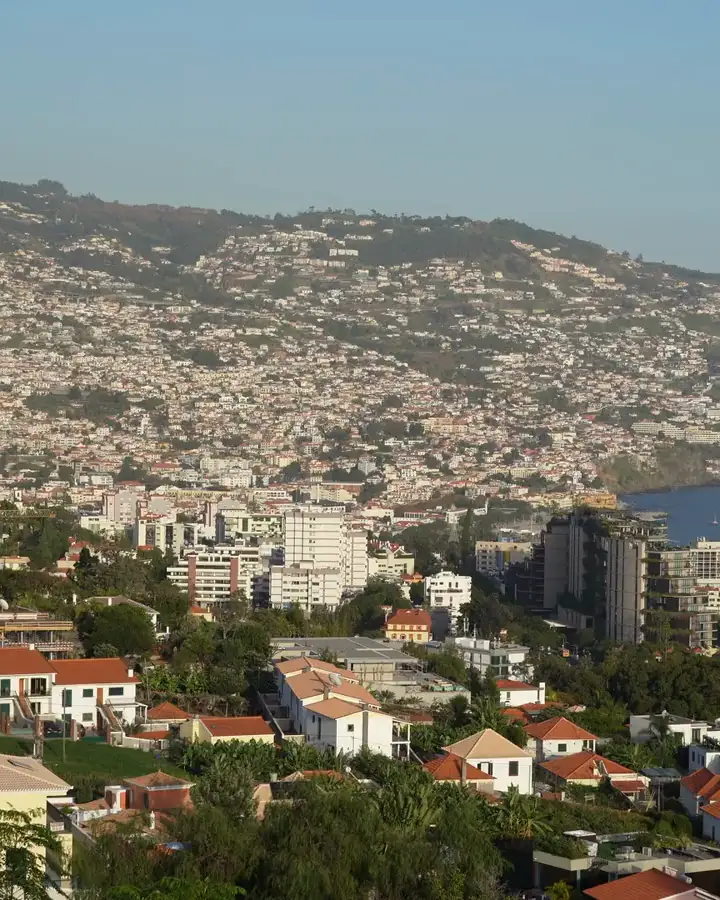
 Portugal
 Denmark
 United Kingdom
 Finland
 Australia
 Mexico
 Costa Rica
 Canada
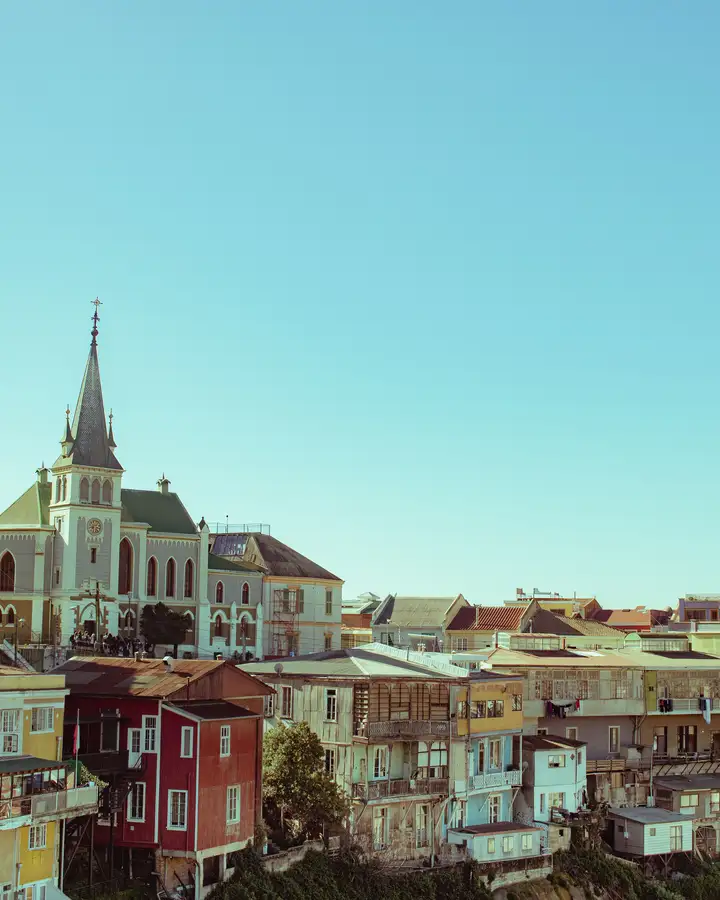
 Chile
Chile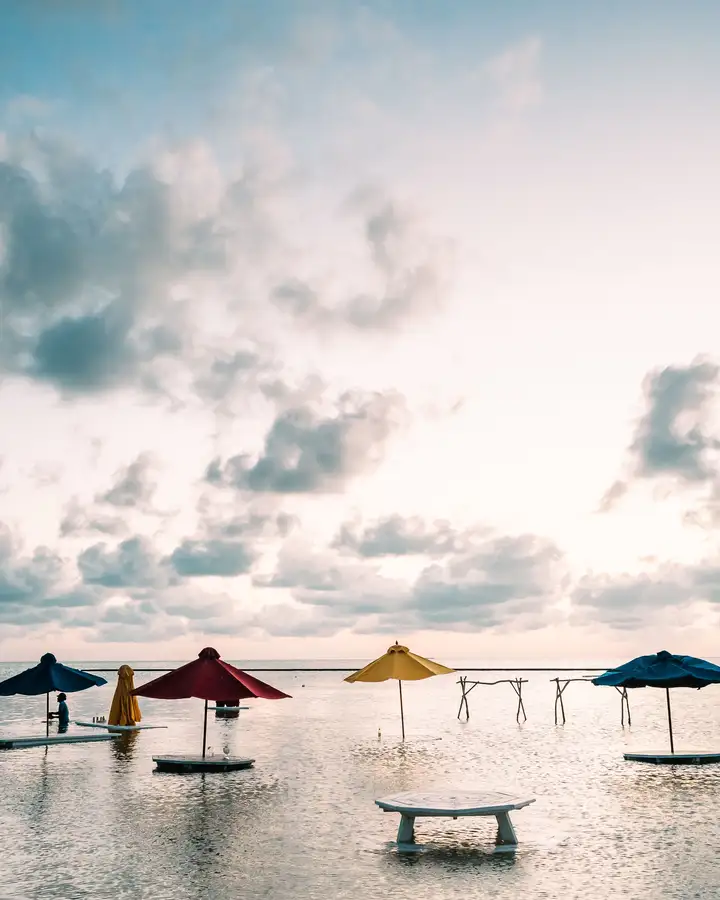
 Belize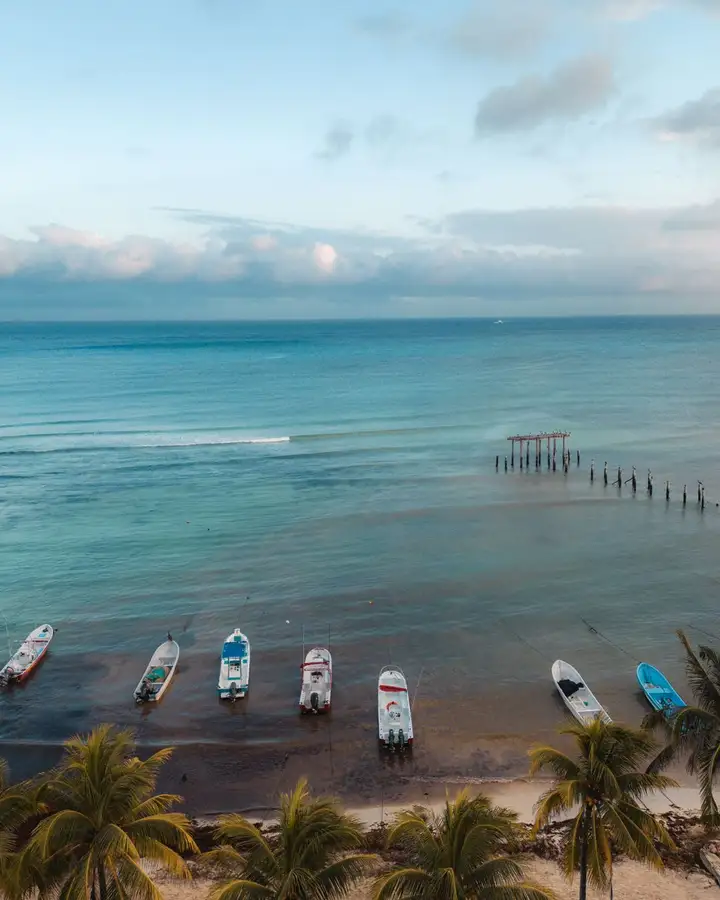
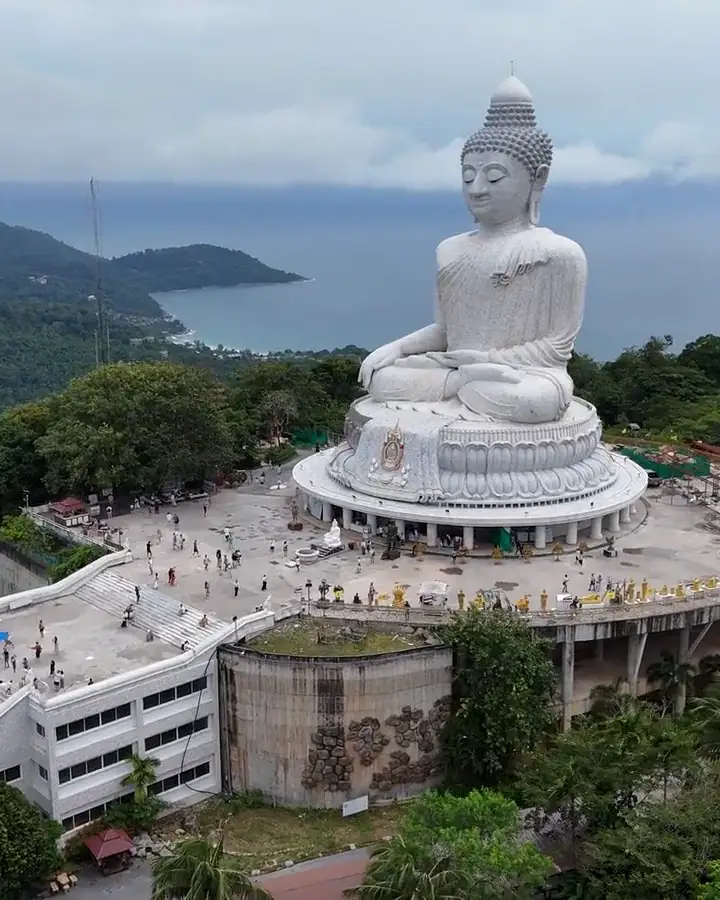
 Thailand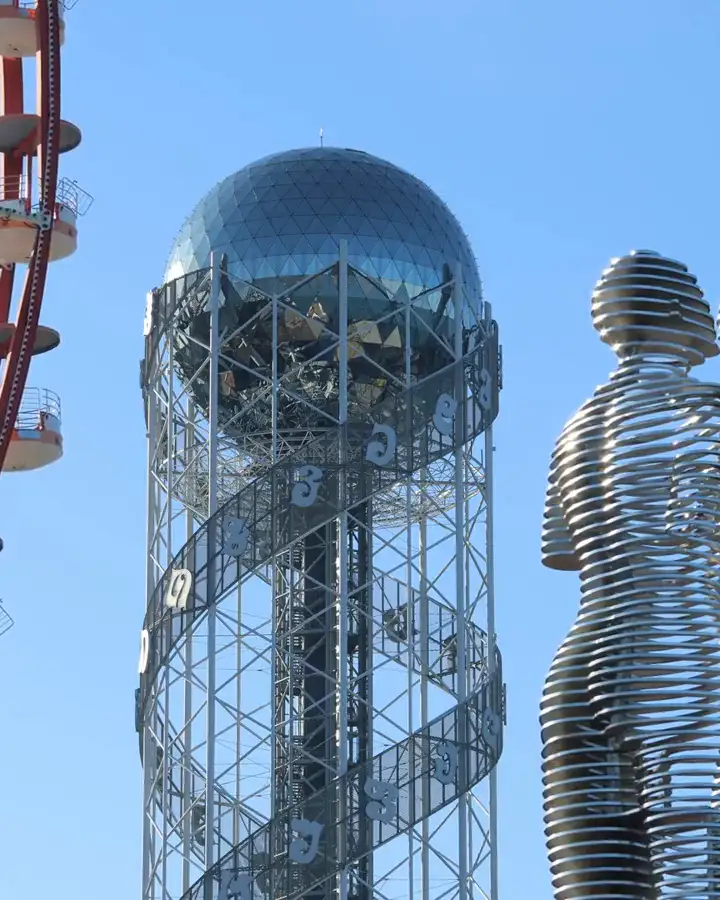
 Georgia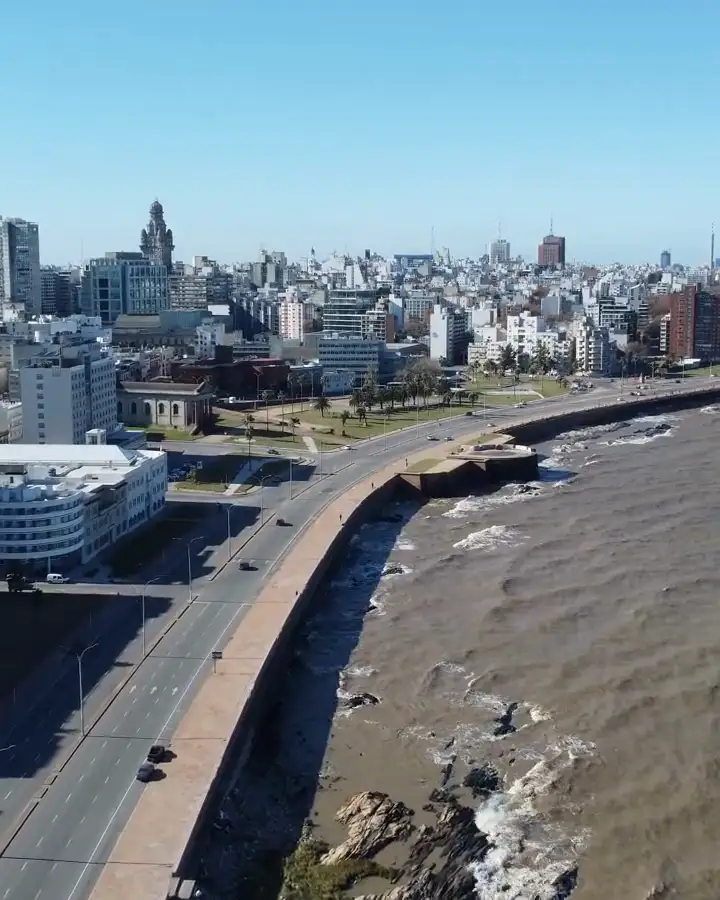
 Uruguay
 Brazil

 Montenegro
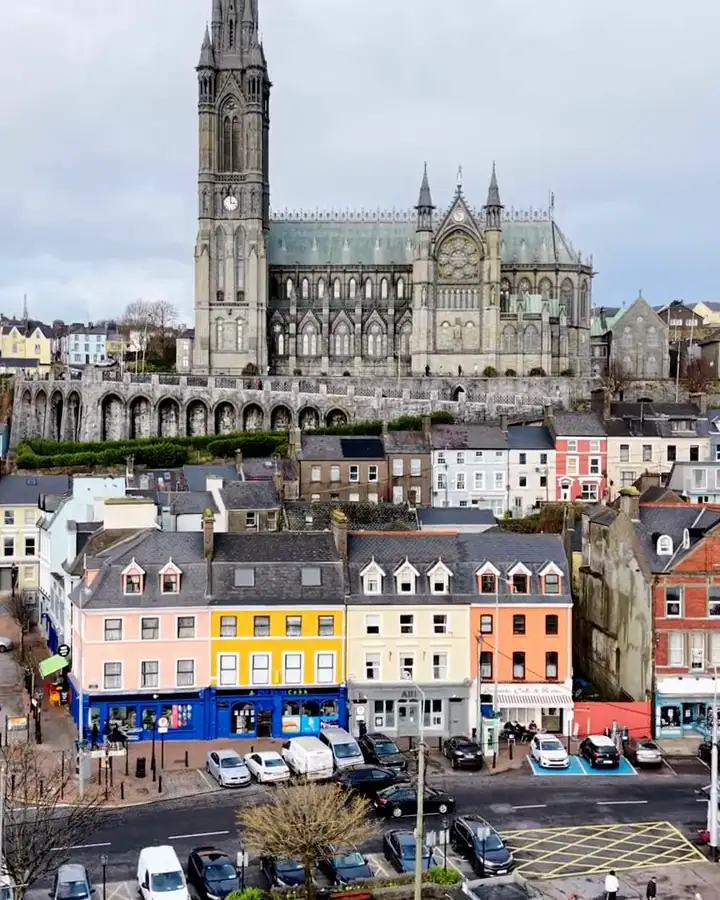
 Ireland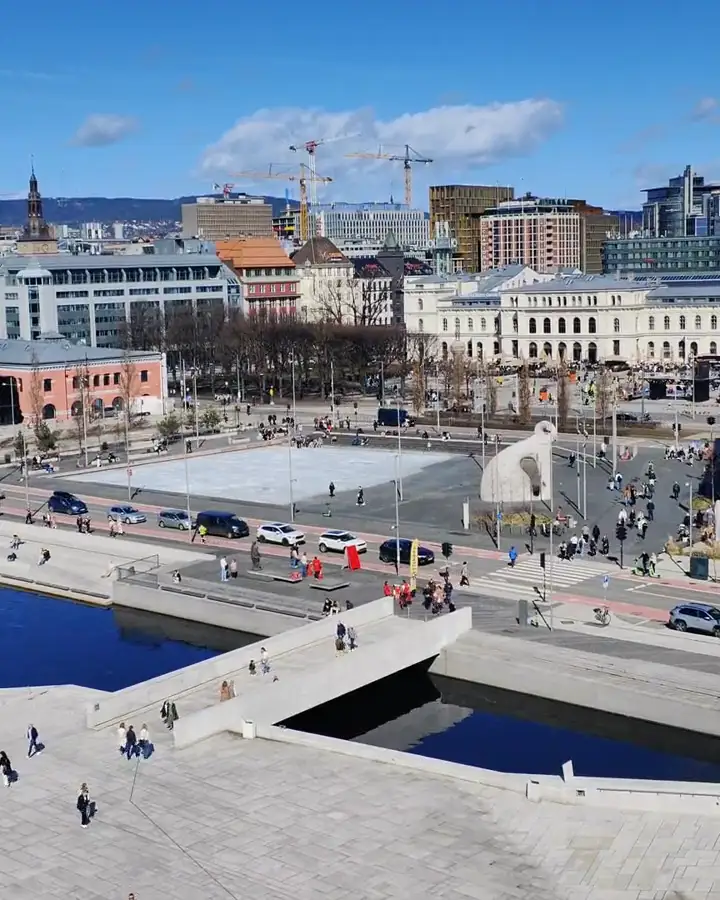
 Norway
 Japan
Japan
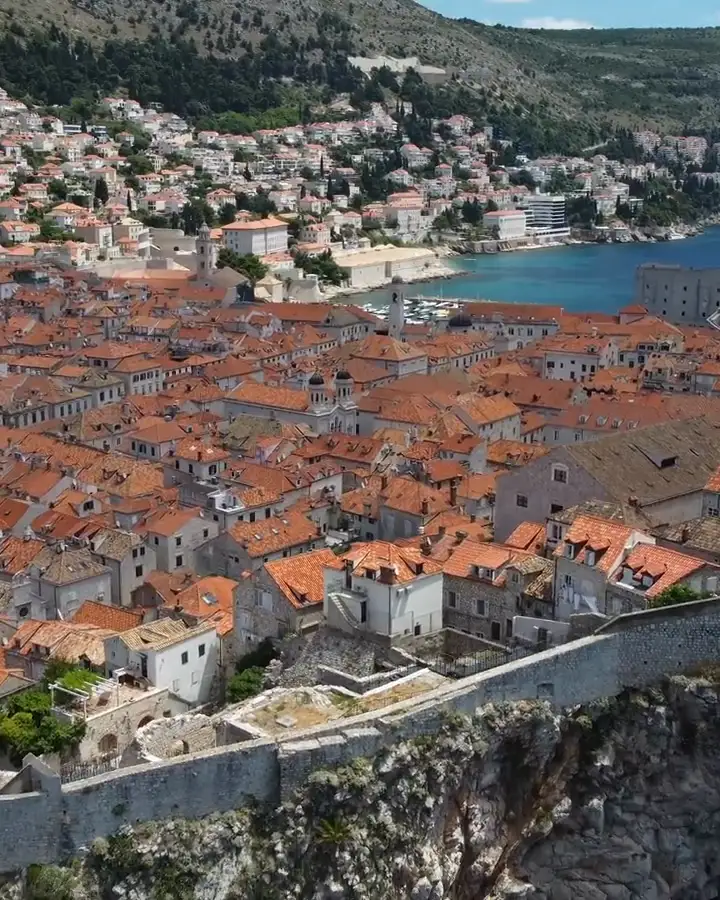
 Croatia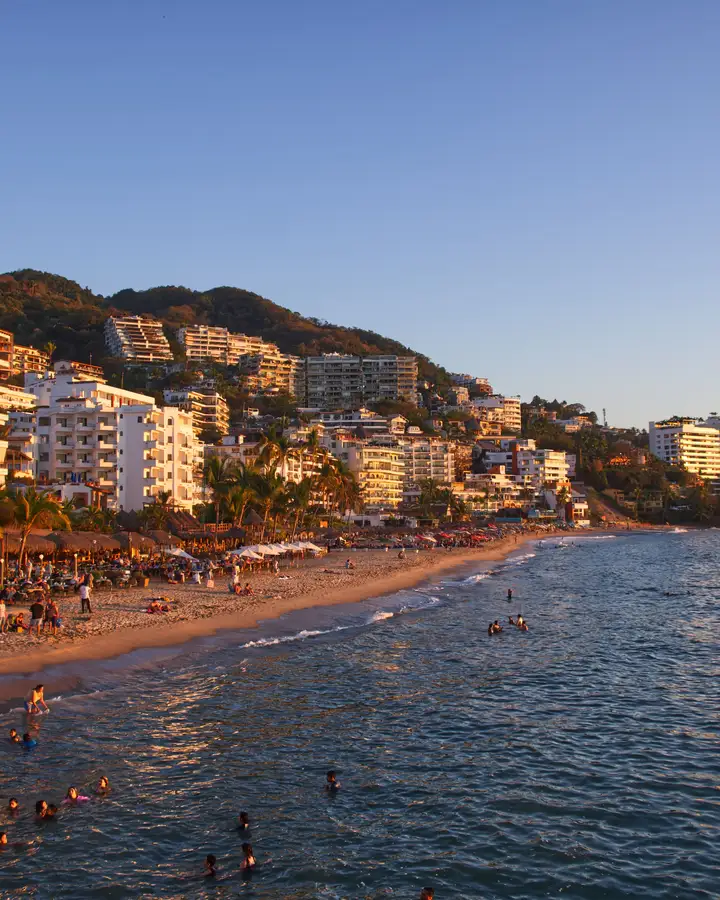
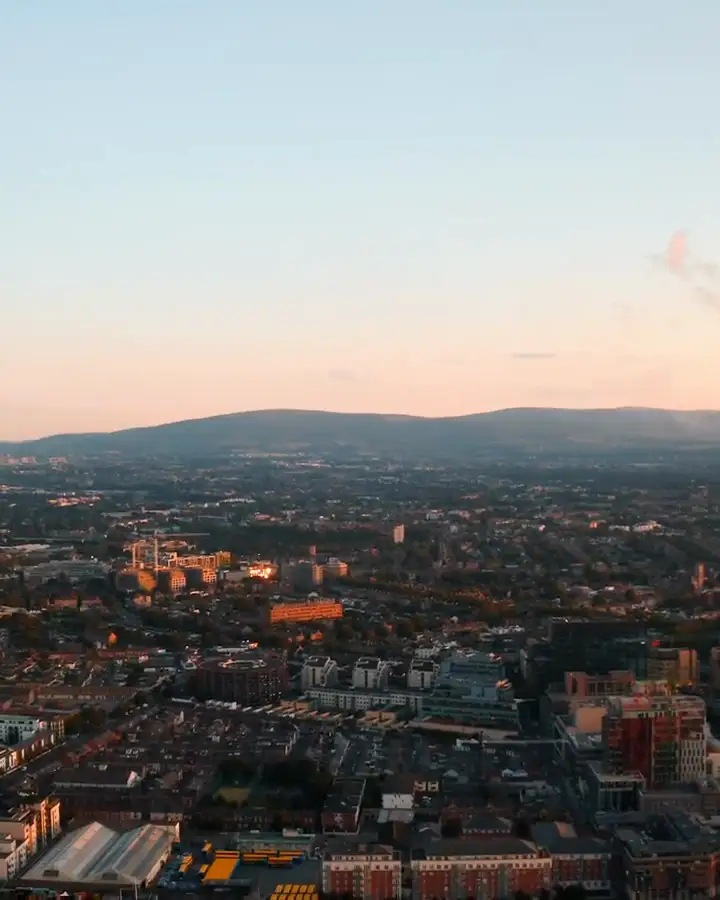
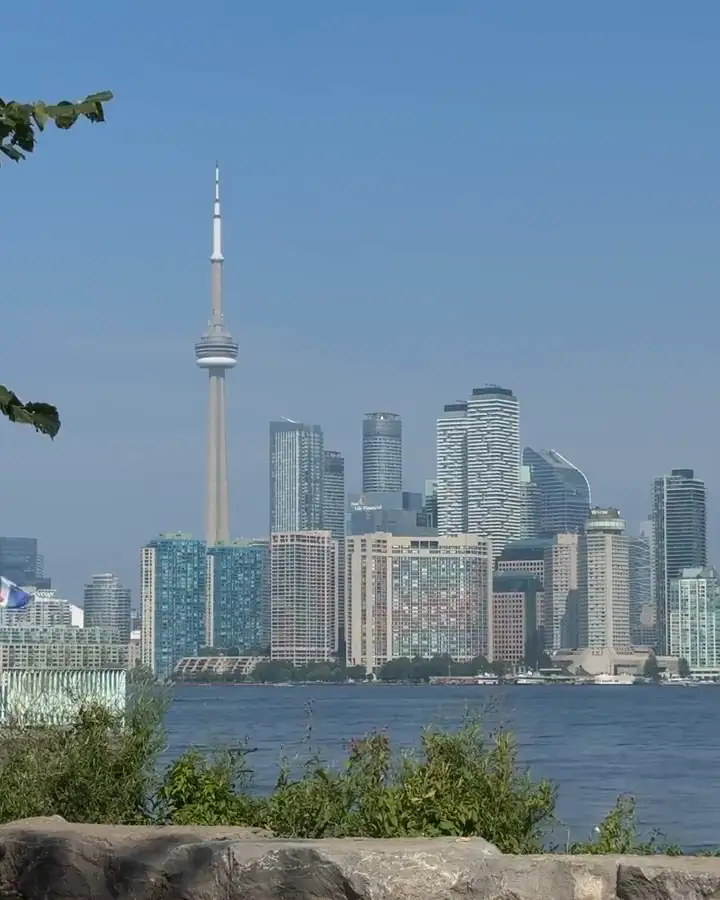
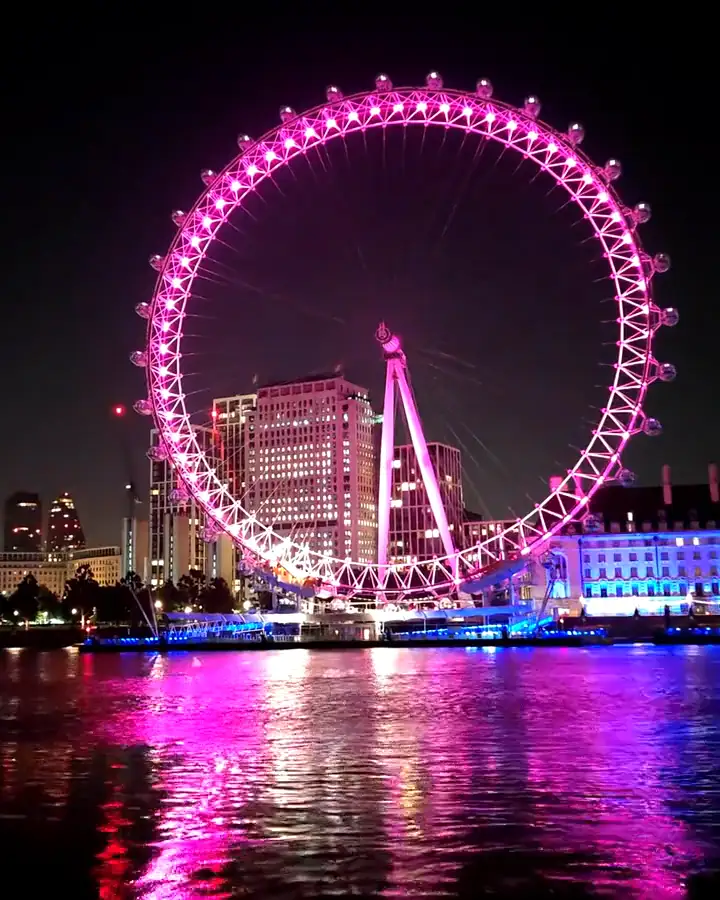
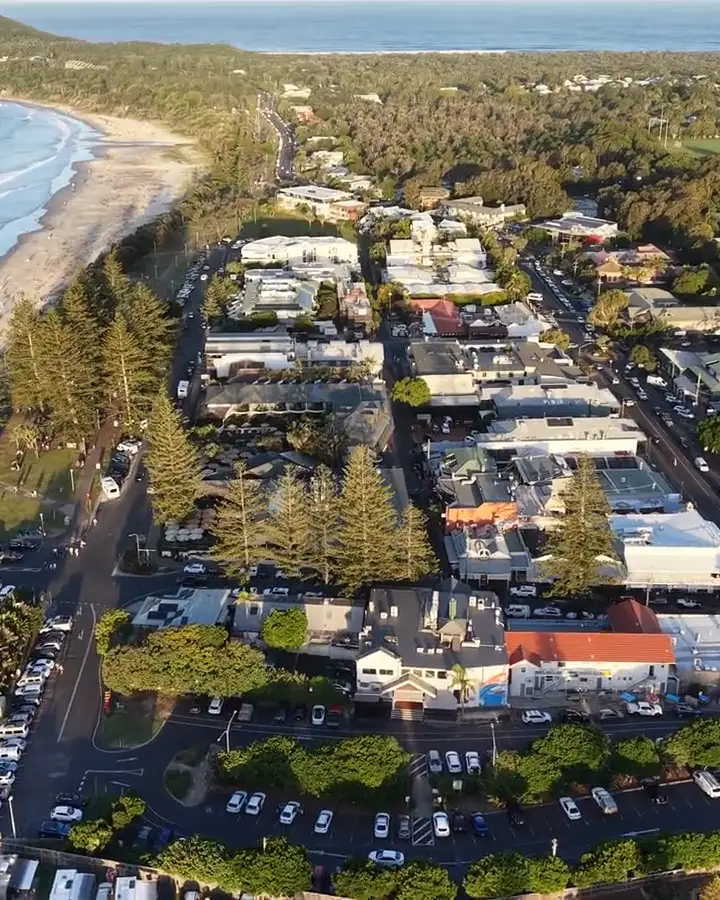
 Iceland
How it sorts: each thing you pick scores every place from 0 to 1 for your month (warm: afternoons from 64°F (18°C) up; mild: close to 75°F (24°C); dry: under 7 inches (180 mm) of rain; cheap stay: where its Inside Airbnb median night ranks among these places; clean air: its PM2.5 that month, full at the WHO's guideline of 5 µg/m³ and empty at 35; fast internet: where it ranks in M-Lab's tests; safe: the US travel advice level, with Levels 1 and 2 both counting as everyday travel; easy visa: your passport's entry rule for the country, best for 90 days or more visa-free; shares my work hours: how many hours of a 9 to 5 in your time zone overlap a 9 to 5 there), and the places sort by the average. With nothing picked, it's the best places for your month: mild, dry and safe. The US has no State Department advisory of its own, so it counts as everyday travel. On each card, the bars show the same scores: green is good, amber is middling, red is weak, and an empty bar means no data yet.
Weather: NOAA station summaries, IDEAM for Medellín, NASA POWER elsewhere. Internet: M-Lab's open speed tests within 25 km of each place over the last 12 months, each user counted once a day (read in BigQuery; a place needs 1,000 tests from 100 users, else the tests within 60 km, else the country's figure, and says which). Safety: the US State Department's advisories, read 2026-09-29. Cost of living: one person's month, with rent from the lower quarter of Inside Airbnb's month-long whole homes (June 2026, CC BY 4.0) where it covers the city and estimated from the country's housing prices elsewhere, and the rest from the Bureau of Labor Statistics' 2024 spending survey at the country's prices (World Bank ICP 2021, CC BY 4.0). Stay cost: Inside Airbnb's median night for a whole place. Air: fine particles (PM2.5) from OpenAQ's open air quality data, the nearest 3 government monitors within 25 km (else low-cost sensors) whose data license allows commercial use, each month's average since 2023, credited on each place's page; where no station is within 25 km, an estimate from Copernicus's CAMS global reanalysis (monthly PM2.5, 2023 to 2025, CC BY 4.0), adjusted to the stations, and labeled as one. Visas: your passport's rules from the data behind the visa-free countries map. Videos and photos from Pexels, Coverr and Wikimedia Commons, credited on each place. Music from Coverr.
Embed this tool on your site
Paste the code into any page: WordPress, Webflow, Squarespace, Ghost or plain HTML. It's free with the credit under it, which links back to navid.me.
Looking for the cities with the cleanest air in the world? This free finder ranks 85 cities and islands by the fine particles (PM2.5) measured at the air quality stations near each one, month by month.
In this guide, I'll show you:
- What the city with the cleanest air is, and who this is for
- The 20 cleanest places, with their cleanest and haziest months
- The cleanest places in each region
- The haze and smoke seasons to plan around
- How the air is measured
Open any place for its air by month, with the stations it comes from, and the rest of its guide.
 TL;DR
TL;DRKey takeaways
What is the city with the cleanest air?
Of these places, Alicante has the cleanest air, with about 3 µg/m³ of fine particles (PM2.5) over a year, within the WHO guideline.
PM2.5 are particles under 2.5 micrometers across, from traffic, industry, fires and dust. They're small enough to reach deep into the lungs, which is why the WHO sets its tightest guideline for them.
Who is the cleanest air finder for?
It's for anyone who weighs the air when choosing where to live or stay:
- Digital nomad locations – nomads weighing air against weather, cost and internet
- Climate finder – anyone matching clean air with the right weather
- Visa-free countries – travelers checking how long they can stay once they've picked a place
- Country finder – people moving abroad for good, comparing whole countries
The air changes by season and by street, so check the month you'd be there.
The 20 cleanest places
Here are the places with the lowest PM2.5 over a year, from the stations within 25 km of each one:
- PM2.5 over a year
- 3 µg/m³
- Cleanest month
- May
- Haziest month
- August
- PM2.5 over a year
- 4 µg/m³
- Cleanest month
- March
- Haziest month
- December
- PM2.5 over a year
- 4 µg/m³
- Cleanest month
- December
- Haziest month
- February
- PM2.5 over a year
- 4 µg/m³
- Cleanest month
- September
- Haziest month
- January
- PM2.5 over a year
- 4 µg/m³
- Cleanest month
- August
- Haziest month
- October
- PM2.5 over a year
- 4 µg/m³
- Cleanest month
- May
- Haziest month
- March
- PM2.5 over a year
- 4 µg/m³
- Cleanest month
- November
- Haziest month
- May
- PM2.5 over a year
- 5 µg/m³
- Cleanest month
- March
- Haziest month
- August
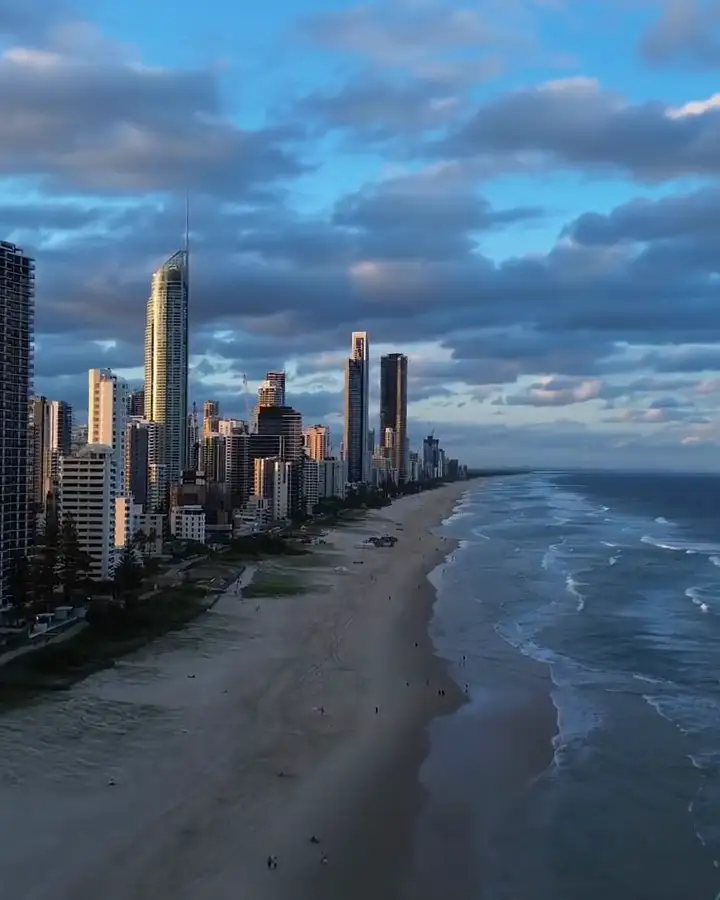 Gold Coast
- PM2.5 over a year
- 5 µg/m³
- Cleanest month
- May
- Haziest month
- October
- PM2.5 over a year
- 6 µg/m³
- Cleanest month
- October
- Haziest month
- March
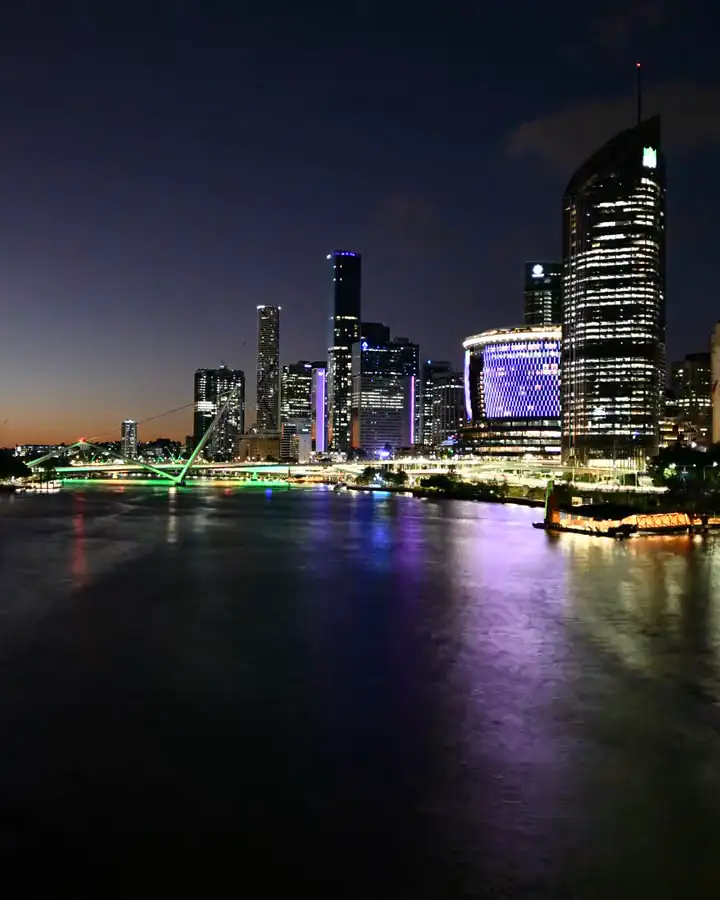 Brisbane
- PM2.5 over a year
- 6 µg/m³
- Cleanest month
- April
- Haziest month
- September
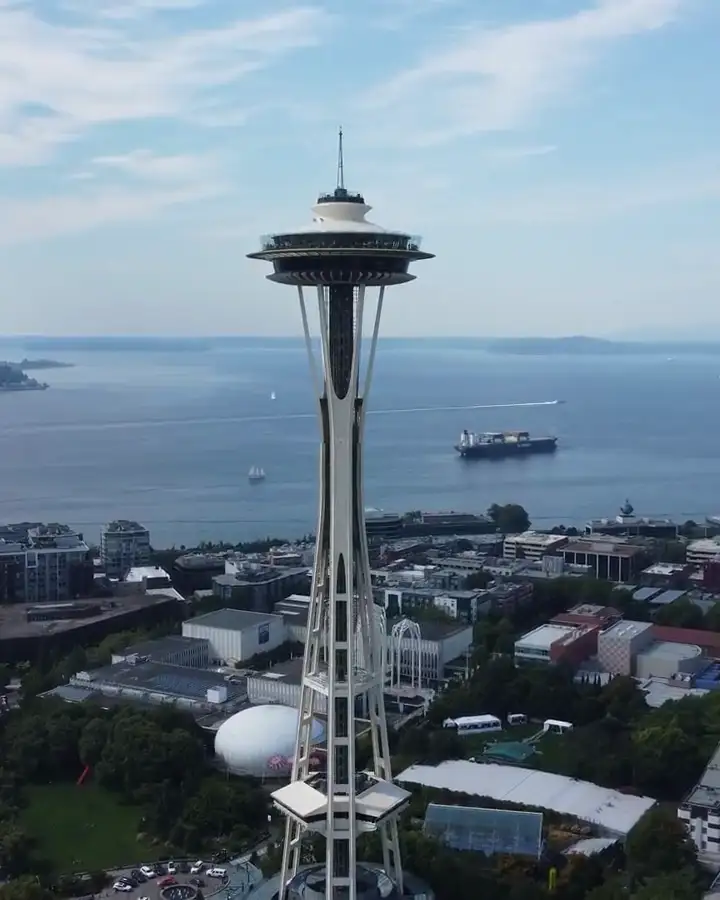 Seattle
- PM2.5 over a year
- 7 µg/m³
- Cleanest month
- May
- Haziest month
- January
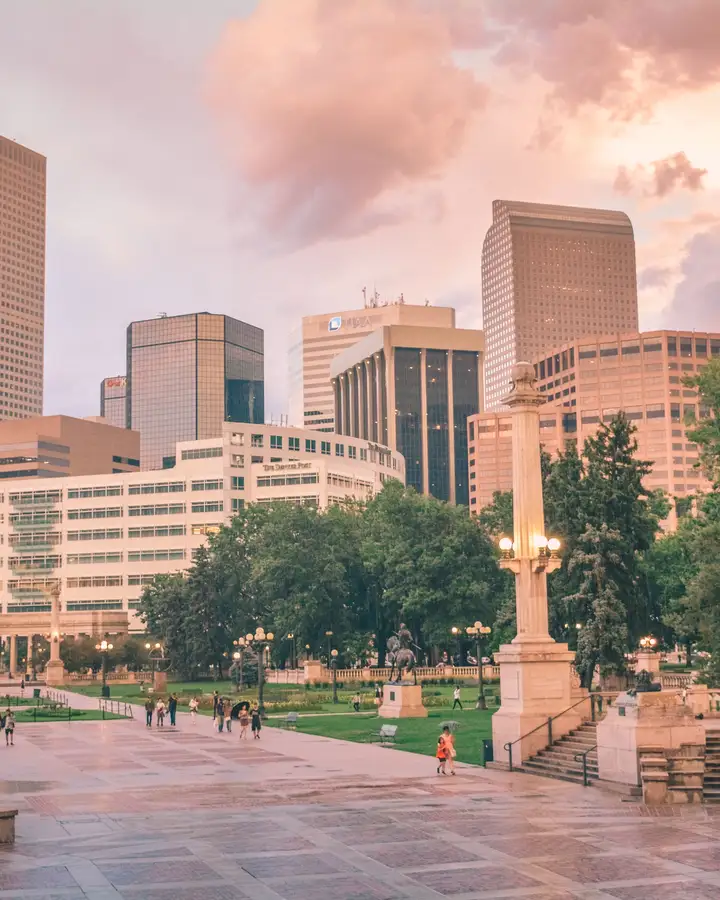 Denver
- PM2.5 over a year
- 7 µg/m³
- Cleanest month
- December
- Haziest month
- February
- PM2.5 over a year
- 7 µg/m³
- Cleanest month
- March
- Haziest month
- December
- PM2.5 over a year
- 7 µg/m³
- Cleanest month
- July
- Haziest month
- January
- PM2.5 over a year
- 7 µg/m³
- Cleanest month
- July
- Haziest month
- March
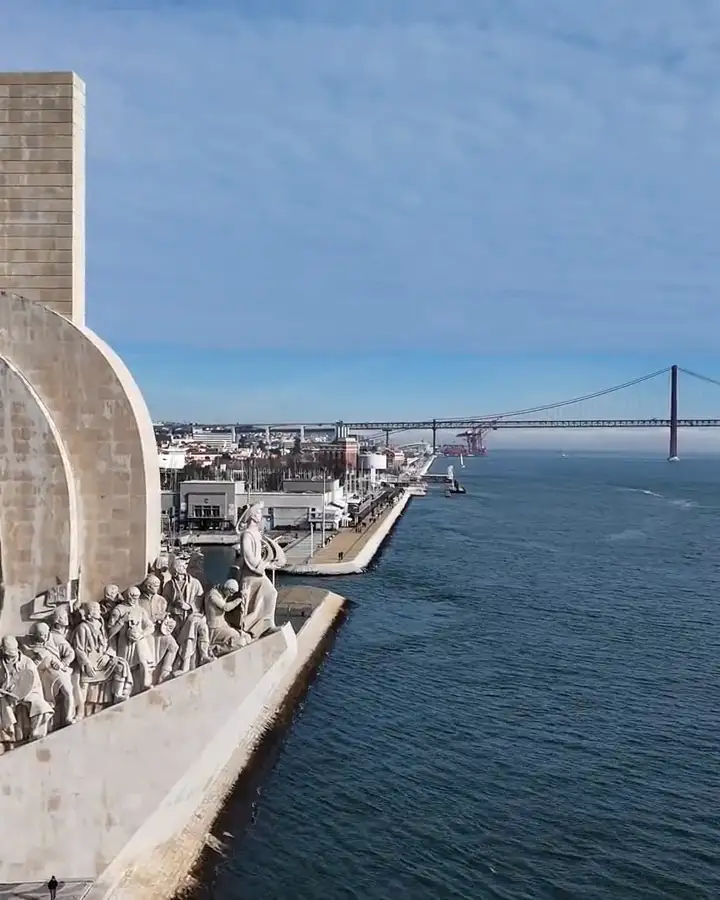 Lisbon
- PM2.5 over a year
- 7 µg/m³
- Cleanest month
- July
- Haziest month
- January
- PM2.5 over a year
- 8 µg/m³
- Cleanest month
- April
- Haziest month
- June
- PM2.5 over a year
- 8 µg/m³
- Cleanest month
- May
- Haziest month
- January
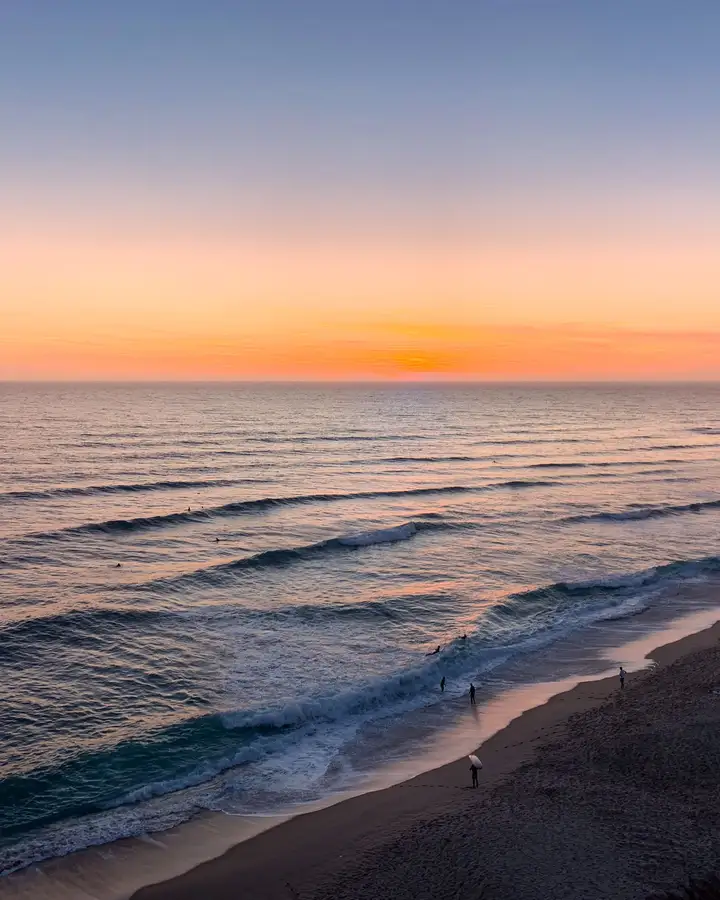 Ericeira
- PM2.5 over a year
- 8 µg/m³
- Cleanest month
- November
- Haziest month
- January
A place gets a figure only when a station near it allows its data to be used this way, so some cities aren't ranked yet.
The cleanest places by region
Here are the three cleanest places in each region, by the same stations:
- Europe – Alicante (3 µg/m³), Funchal, Madeira (4 µg/m³), Tallinn (4 µg/m³)
- Asia – Kyoto (9 µg/m³), Osaka (10 µg/m³), Tokyo (10 µg/m³)
- Latin America – San Juan, Puerto Rico (12 µg/m³), São Paulo (13 µg/m³), San Miguel de Allende (14 µg/m³)
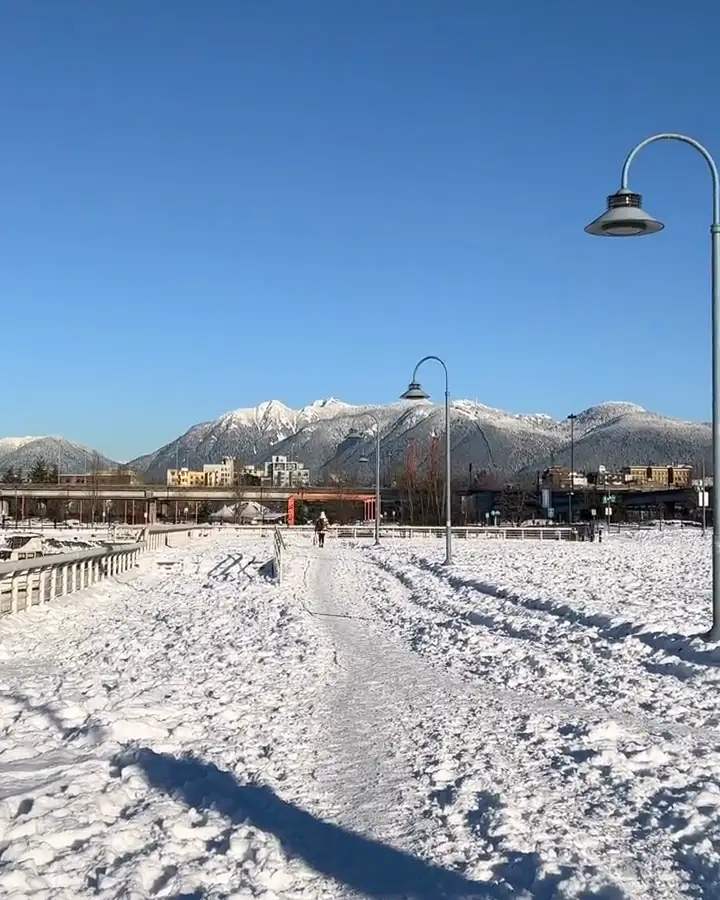
- North America – Honolulu (4 µg/m³), Vancouver (5 µg/m³), Seattle (7 µg/m³)
- Africa – Kigali (45 µg/m³)
- Oceania – Gold Coast (5 µg/m³), Brisbane (6 µg/m³)
Each place's guide shows its air for every month.
Haze and smoke seasons to plan around
These places have one stretch of the year when the air gets much worse, at least twice their cleanest month:
- Kathmandu – about 94 µg/m³ in April, against 15 in August
- Kigali – about 76 µg/m³ in July, against 26 in November
- Hanoi – about 68 µg/m³ in January, against 25 in July
- Guadalajara – about 56 µg/m³ in October, against 16 in July
- Belgrade – about 41 µg/m³ in December, against 11 in August
- Kuala Lumpur – about 39 µg/m³ in October, against 7 in December
- Milan – about 38 µg/m³ in February, against 8 in May
- Colombo – about 34 µg/m³ in February, against 10 in September
- Thessaloniki – about 31 µg/m³ in January, against 10 in May
- Cluj-Napoca – about 30 µg/m³ in February, against 8 in May
Pick that month in the finder to see the difference, or plan a trip around it.
How the air is measured
Every figure comes from OpenAQ, an open archive of air quality stations around the world.
For each place, I take the nearest three government monitors within 25 km, and only stations whose data license allows this use.
Each month is that station's average since 2023, and a place's figure is the middle of its stations.
Only places with government monitors are ranked. Places with just low-cost sensors nearby show their air on their own page, as those sensors read less precisely, often high in humid air.
Where the numbers come from
Every figure comes from an open source, and each place's page names its own:
- Weather – NOAA's monthly station summaries where a station is close, IDEAM's normals for Medellín, and NASA POWER's climate averages elsewhere
- Internet – M-Lab's open speed tests within 25 km of each place over the last 12 months
- Everyday prices – the World Bank's price level for the country, where 100% means US prices
- Safety – the US State Department's travel advisory level, with Levels 1 and 2 both counting as everyday travel
- Air – fine particles (PM2.5) from OpenAQ's open air quality data, the stations within 25 km whose license allows commercial use, each month's average since 2023
The videos and photos come from Pexels, Coverr, Pixabay and Wikimedia Commons, each credited on its place.
More ways to find your next place
These tools use the same places and data, each for a different question:
- Digital nomad locations – every place, with your own picks for the month
- Climate finder – where the weather is right in any month
- Best places to travel right now – this month's best places
- Fastest internet cities – the places ranked by M-Lab's speed tests
- Best value cities – the most livable places for what life costs
- Most livable cities – weather all year, safety and internet
- Random travel destination generator – one place, picked for you
- Visa-free countries – how long your passport lets you stay
- Internet speed test – your own line, on the same M-Lab test
Every place links to its own guide, with the weather by month, the internet and the visa, tax and money tools for its country.
Cleanest air cities FAQs
Questions about it? Here's what to know.
Of these 85 places, Alicante has the cleanest air, at about 3 µg/m³ of PM2.5 over a year.
The figures come from the air quality stations nearest each place.
PM2.5 is the fine particles in the air, under 2.5 micrometers across, from traffic, industry, fires and dust.
They're measured in micrograms per cubic meter (µg/m³).
The WHO's 2021 guideline is 5 µg/m³ averaged over a year, and 15 µg/m³ over a day.
It also sets interim targets of 10, 15, 25 and 35 for places working toward the guideline.
Heating in winter, farm burning, wildfires and dry-season dust all raise PM2.5 at certain times of year.
Pick a month in the finder to see each place's air then.
A place needs a station within 25 km whose data license allows this use, with a year of readings.
Some countries' stations don't carry an open license yet, so their cities aren't ranked.
From OpenAQ, an open archive of government monitors and low-cost sensors.
Each place's page names its stations, their owners and their licenses.
I did. I'm Navid Moazzez, and the cleanest air finder is one of my free tools on navid.me.
Read about me, or see my creator profile.
Navid Moazzez
AI business strategist & AI OS builder
Navid Moazzez helps creators and founders master AI and build their own AI Operating System (AI OS) to automate their business and life.
Navid.me is reader-supported. When you buy through links on this site, I may earn an affiliate commission. Learn more.
More free tools


 X
X Bluesky
 LinkedIn
 Threads

 Mastodon
 Instagram
Related MCP servers & CLIs


 Substack
 TikTok


 Apple Podcasts
 Free AI newsletter
The most actionable AI newsletter for founders
Every week, get proven AI strategies, curated tools, and step-by-step systems to grow your audience, create better content, and build a profitable creator business.
No fluff, no filler, no BS. Just five minutes each week that might level up your online business and life.
P.S. Sign up now to get free access to my ultimate AI tools guide for creators.